North American Solution to Climate Change
We are now facing one of humankind’s greatest challenges. It is apparent that our use of fossil fuels to generate electricity is one of the many contributing factors threatening the very existence of many of the Earth’s species along with the way we live and conduct our business. The good news is that there are new and innovative companies and technologies that are rising up to address this challenge. In meeting this challenge, these companies are seizing one of the greatest business opportunities in history.
The solution to climate change lies in electrifying the entire energy sector and transitioning the electric supply to 100% renewable, 100% of the time. The pressure to move as fast as possible to this goal is increasing exponentially every year. Local, state and national governments across the globe are passing legislation that is pushing the limits of our electric distribution systems. Most of the time, renewable generation from wind and solar does not match the load. Often, in many areas today, there is more renewable generation than load. In order to achieve our renewable goals, the world is in desperate need of a low-cost electric storage solution and the technology exists today to fully address the problem.
This Blog is intended to outline a comprehensive solution to climate change. By transforming the entire energy sector to electricity along with transforming the electric generation fleet to renewable sources, the solution will be less expensive than continued reliance on fossil fuels. For example, based on the current residential electric rates, operating an electric vehicle is less expensive than a fossil fuel counterpart. Using an air-source or geothermal heat pump, with a coefficient of performance of 3.0 or better, it is less expensive to heat and cool a home than using fossil fuels. Better yet, direct thermal heating from the sun is the least expensive and most efficient of all.
The technology currently exists to create solutions to remove carbon from the energy supply and reverse the current trend towards climate destruction. Those solutions include -
Construction of a North American High Voltage transmission grid to move renewables between the coasts and provide an additional 3 hours of solar energy.
Implementing the technology to ensure the grid can isolate events in order to provide maximum security and resiliency.
Maximizing the ability of the grid to handle additional solar and wind generation while minimizing infrastructure costs. Maximizing existing hydro resources by transitioning these assets to be a peaking resource that will be used when there are inadequate wind and solar resources.
Providing real time communication to enable appliances and plug devices to interact with the grid so that load can be shifted to maximize the output of renewable generation.
Provide consumers the ability to take control of their energy costs and save money through real time pricing communications directly to appliances, plug loads, and electric vehicle charging.
Providing the solutions to enable the transformation of heating, cooling and transportation to all run on electricity.
Implementing the process of moving our energy sector to 100% renewable, 100% of the time.
Accomplishing .these goals without increasing electric rates.
Summarizing the steps required to accomplish these goals.
Understanding the Challenge
Let’s start with the basics of electricity. Today’s electric grid is one of humankind's greatest accomplishments. We have connected every home in America to the electric grid. In the 1930s people only had access to electricity if they lived in a city or a town. Over ½ of America was in the dark. Franklin Delano Roosevelt signed an executive order that formed the Rural Electrification Administration, which ultimately led to the grid we have today. 80 years later, we have significantly more resources available for the next level of transformation.
This interconnected electric grid is defined by physics as an unstable system. A system is unstable if, when displaced, it accelerates away from the displacement. Only when you apply external force can the system be returned to stability. An example is a ball barely resting on a hill. Once displaced, it accelerates down the hill. You have to apply an opposing force, such as blocking it, to stop it. Once the grid starts losing its inertia, if you do not introduce new inertia, the entire grid can collapse quickly. Here is traditionally how inertia, or momentum is provided to the grid.
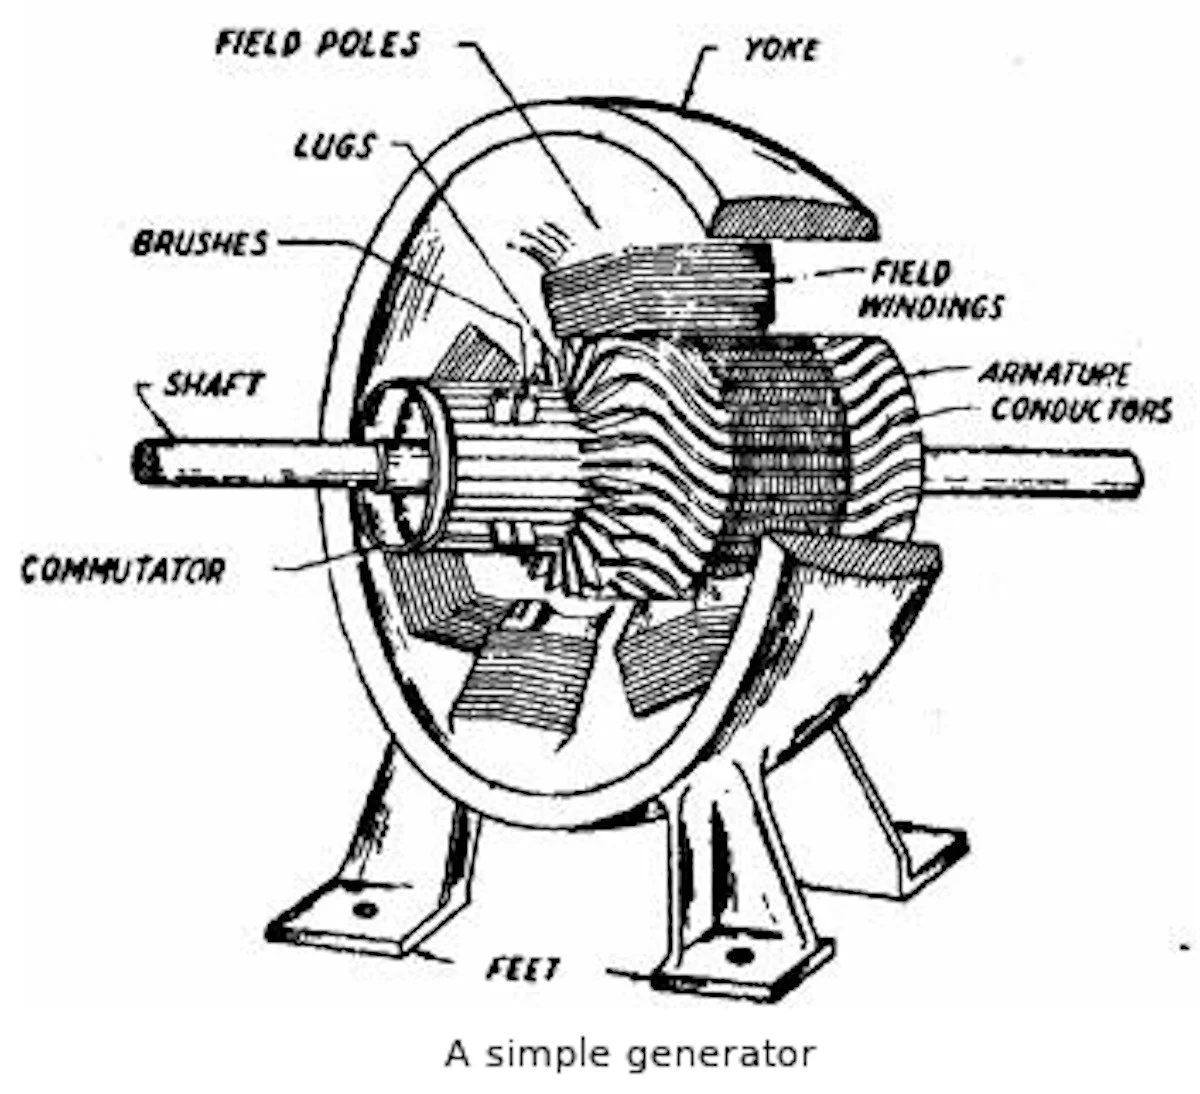
The grid was designed for spinning generation. A generator has a shaft that rests in a magnetic field. The shaft is connected to a flywheel that provides inertia. An outside force, such as a motor spins the shaft exciting the electrons in the winding on the spinning poles which produces electricity as those windings pass through the magnetic field. That electricity is then sent over wires through the grid to your home or business. This inertia is important as it keeps everything spinning at the same speed in spite of brief interruptions, surges, or fluctuations.
These generators are all interconnected by the grid and are designed to run at a rate based on a continuous and exact frequency be held at 60 cycles per second. For effective and safe operation of the electric grid, it is very important that the frequency and voltage be controlled tightly. The entire connected grid runs on the same timing and voltage. Without consistency of these critical elements that need to be monitored every millisecond, the grid can quickly collapse.
The electric grid is a huge lake of energy. This lake of energy has millions and millions of things taking water (electricity) out of the lake at varying flow rates every minute, every millisecond. In order for everything to run exactly at the 60 cycle per second timing, the aggregate of water coming into this lake of energy must exactly match the water withdrawn from the lake at all times - down to the millisecond. It is up to the grid operators to ensure everything is in balance - that energy use vs. inputs match precisely
In the old grid, where our electricity came from central power plants, the spinning generators provided inertia. This inertia protected the grid from momentary power interruptions that were common due to things like equipment failure, switching delays, or lightning strikes. This inertia provides ”forgiveness” to our grid. Much like a car driving down the road, if it encounters a large pothole, the car doesn’t stop. The inertia results in the car going right over the pothole before the driver can react. Even when the grid consisted almost entirely of centralized generation using spinning generators, problems could occur that would overcome the built-in inertia.
For example, the Northeast blackout of 2003 was a widespread power outage throughout parts of the Northeastern and Midwestern United States, and the Canadian province of Ontario on August 14, 2003, just after 4:10 p.m. EDT. Some power was restored by 11 p.m. however, most customers did not get their power back until two days later. In other areas, it took nearly a week or two for power to be restored. The blackout's primary cause was a software bug in the alarm system at the control room of First Energy Corporation, an Akron, Ohio–based company, causing operators to remain unaware of the need to re-distribute load after overloaded transmission lines dropped in voltage. What should have been a manageable local blackout cascaded into collapse of the entire electric grid.
The Challenge of Wind
Wind and solar generation introduce two types of instability to the grid. First, both generation sources use electronic inverters to convert the electricity that is generated to electricity that is suitable for connection to the electric grid. While a wind turbine does spin, the inertia of the spin is not tied to the grid and therefore does not provide the benefits of inertia that we have with centralized spinning generation. The turbine blade spins a generator whose output is put through an electric conversion before it is connected directly to the grid.

This is to enable maximum output in every wind speed as well as to provide maximum operational flexibility. While the configuration optimizes the turbine to obtain maximum power, it does introduce additional instability to the grid. As we move forward with moving the electric grid, this instability must be accounted for. One of the greatest considerations with wind is how to account for the puffiness and non-linear nature of wind. As the chart below shows, wind can be very erratic.
The output of wind turbine can quickly rise and fall. The nature of wind varies with the location of the turbine, so the impacts vary as well. Off-shore wind tends to be more stable than on-shore wind. Wind in the flat geography of the Midwest tends to be more stable than ridge-line wind in the east. A wind turbine on the ocean or in the Midwest can produce twice as much as one in hilly terrain.
As was stated earlier, the grid was designed for spinning generation, which ramps up smoothly and once the generator is up to full output, it stays there. As a result, damping and ride-through needs to be added to the grid as more and more wind and solar are deployed Damping is what is needed to correct for momentary sags in the grid caused by the cloudiness over solar and brief puffiness of wind. Ride-through is the ability to continue to provide electricity for brief outages, such as a lightning strike or a branch making contact as it falls from a tree. We can redesign the grid to accommodate for the choppiness and provide the necessary damping and ride-through. The solutions are off the shelf, straightforward and will be addressed later as part of the overall solution.
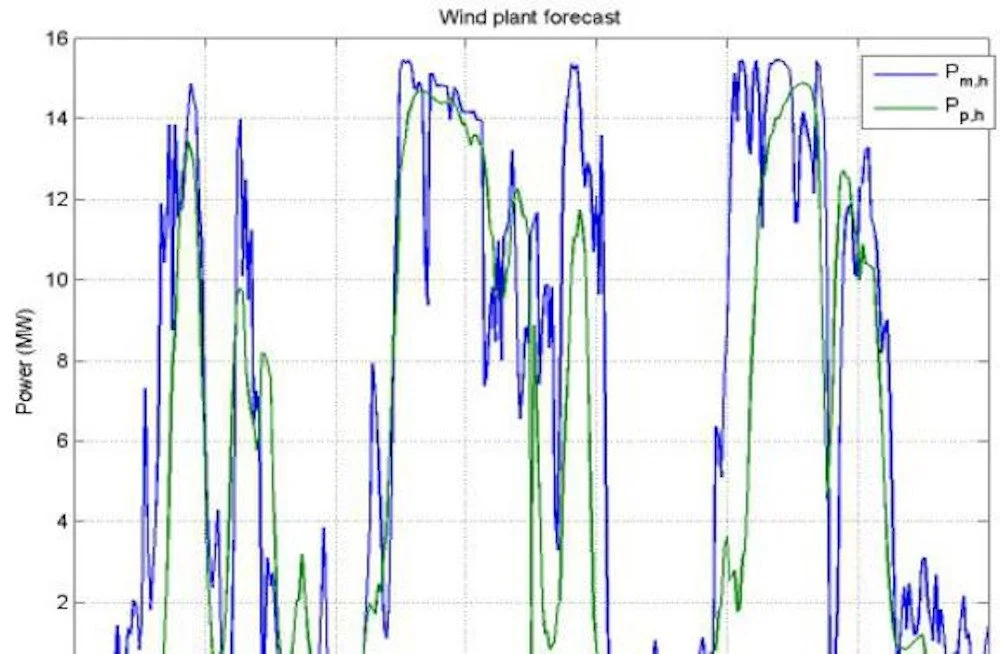
Example of the variability of wind generation
The Challenge of Solar
Solar generation has similar issues to wind. Solar cells individually produces electricity at 0.6 volts direct current (DC). They are connected in series to achieve the voltage needed for the connected inverter. The job of the inverter is to convert the DC voltage to the alternating current (AC) voltage that is required to connect to the electric grid. Similar to the problems that are introduced by wind generation, these inverters lack the inertia that the centralized spinning generation provided for the grid. That inertia now needs to be installed on the grid using alternative solutions. Presently, that back-up inertia tends to be generators that can automatically respond to grid changes. Those are most likely powered by natural gas.
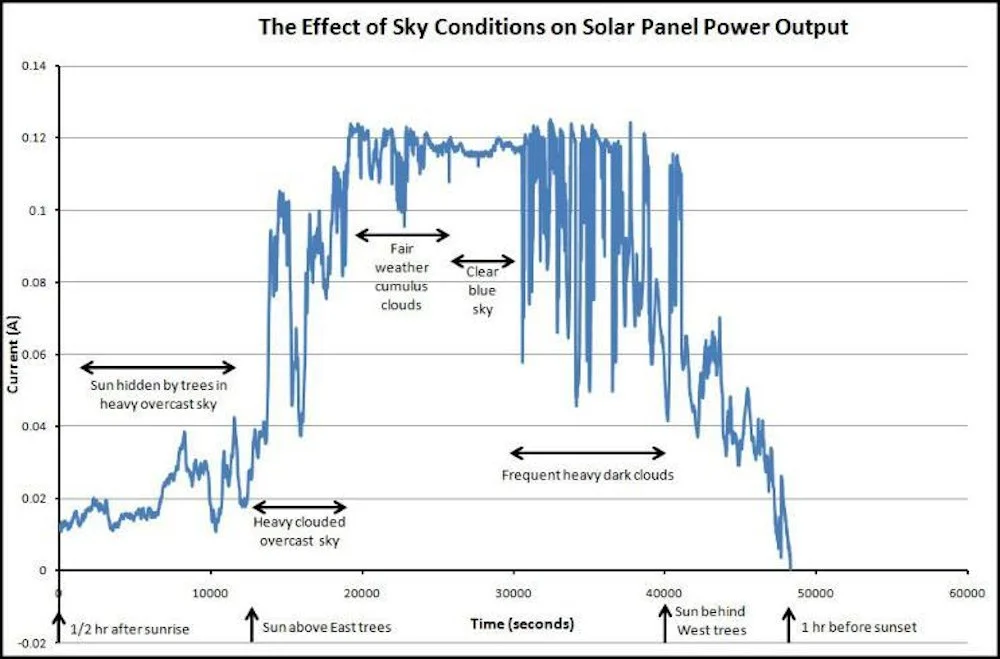
Solar panel output is significantly impacted by sky conditions. In areas of the southwest, with long stretches of sunny weather uninterrupted by clouds, this problem is not as prevalent. However, from fair-weather cumulus clouds to the towering cumulonimbus clouds associated with thunderstorms, these present a challenge to a grid that was designed for the continuous output of spinning generation. The solutions to the choppiness of solar are the same solutions that address the choppiness of wind. Again, the solutions are off the shelf, straightforward, and will be addressed later as part of the overall solution.
The Challenge of Capacity Factor
Another challenge from moving to the continuous nature of centralized spinning generation to renewable generation is the fact that we cannot call on wind and solar when it is needed. Wind and solar does not continually produce 24 hours per day. Using these sources, we are subject to the whims of nature and the reality of the orbit of the sun. A very important measure for matching generation to load is capacity factor.
Capacity factor is the ratio of an actual electrical energy output over a given period of time to the maximum possible electrical energy output over that period. For calculation purpose, the number of hours per year (8760) is used as the baseline. If a solar panel was able to produce its maximum output 24 hours per day for a year, it would have a 100% capacity factor. The fact of the matter is that the sun does not shine at night, and clouds reduce the output even during the day. As the sun rises and sets, the output of the panel is reduced. In the Northern Hemisphere, output in January is significantly less than in June. To determine the practical amount of energy produced from any type of generator, take what is called the nameplate capacity, or what the generator is capable of producing, and then compare that to the actual production.
The formula is as follows: actual annual production/nameplate capacity X 8,760. A typical solar panel in the northeastern United States produces an annual average of 4.2 hours of generation per day. If we input that number into the formula for a 4-kilowatt array, we find the capacity factor as follows; 4.2 hours per day X 4 kilowatts X 365 days per year means the total actual output for the year would be 6,132 kilowatt-hours. The maximum possible energy from this 4-kilowatt array would be 4 kilowatts X 8,760 which would be 35,040 kilowatt-hours. We take the actual output of 6,132 kilowatt-hours and divide it by the maximum output of 35,040 kilowatt-hours and we come up with a capacity factor of 17.5%.
The production capacity of solar and wind is impacted by the seasons. For example, in the Northeast, the wind blows regularly in the winter when the sun is not shining as much. In the summer, solar is productive when the wind is not blowing as much. Wind pairs very well with solar in the northeast. On the northern border of the continental United States, the sun is out for 8-½ hours during the winter solstice and almost 16 hours during the summer solstice.

The use of coal has been trending downward for many decades. Coal has been mainly displaced by natural gas fueled power plants. It is difficult to cycle a coal plant. Natural gas fired plants are designed to respond to changing load conditions. For now, natural gas fired power plants are used as balancing tools for renewable generation. That does not have to be the case, as we will show later in this article.
The good news about the switch to natural gas from coal, is that a kilowatt-hour of electricity produced from a natural gas fired generation facility emits 60% less carbon from the fuel than the same kilowatt-hour produced at a coal fired generation facility.
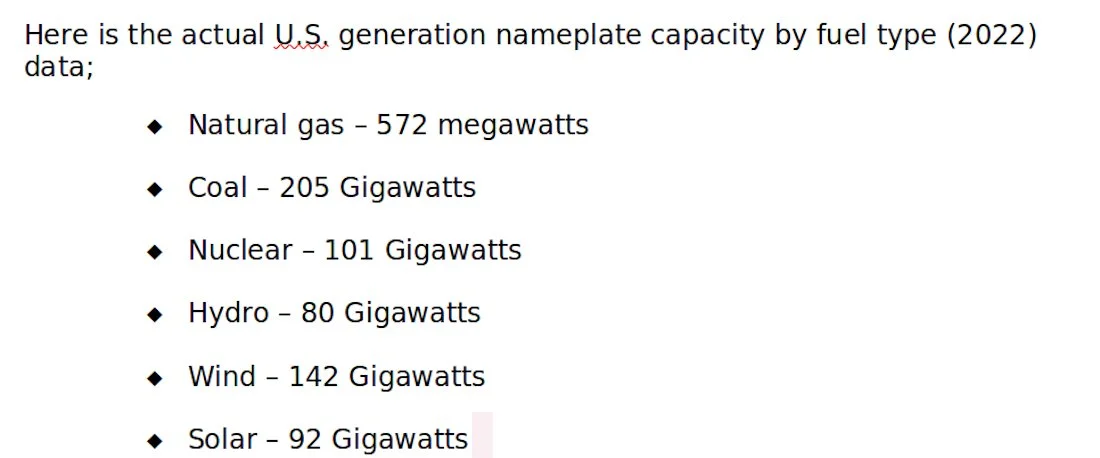
Currently, the United States consumes about 4000 terawatt hours per year. If we add up the total US electric generation sources, the total is about 1500 Gigawatts of generation. Over an annual basis, this shows we have an average capacity factor of 31%. However, the challenge is that the way Americans use electricity today results in a very uneven load pattern, with a lot of usage during the day, and very little at night. This presents a real challenge in our goal to transition to 100% renewable, 100% of the time. The wind blows when it wants to, and solar is controlled by the earth's orbit around the sun. Wind and solar production does not match need (the system load).
The Implications of Capacity Factor
The fact that wind and solar cannot be called for when needed means that in order to solve climate change, grid operators will have move power to where it is needed, change how we use it, or store it until it is needed. All of these issues present very important cost and design implications.
To develop an understanding of the challenge, solar generation alone will be used as an example. The northeastern part of the United States will be the location for this example. First evaluation will run the electric grid 100% of the time on the energy from solar.
The fact is that the sun does not shine all of the time. In the northeast, the capacity factor of solar is 17.5%. To to meet 100% of electricity needs for the entire year, it will be necessary to put up enough solar panels to meet those needs. The way to determine this is simply to divide 100% (total need) by 17.5% (the capacity factor) and this will result in the need to construct approximately 6 times the daily requirement and then store it until it is needed.
The average household in the United States consumes around 900 kilowatt-hours per month. Therefore, to meet the needs of the average household, it is necessary to install 5.4 kilowatt-hours of solar and then store it is required. How much storage is necessary?
The next challenge is with providing solar at the individual level. Because of the changes of the seasons, the panels produce 1/3 of their energies in the winter. This means it will be necessary to increase the number of solar panels by 2/3 to meet the winter needs and dump the power during the summer, or put in enough storage to carry the energy from the summer to the winter. Putting enough storage in place is impractical from a cost standpoint, therefore it will be necessary to increase number of solar panels by 2/3 and install a 15-kilowatt system rather than the 5.4-kilowatt system. At a price of $3.14/watt, the solar production will cost $47K.
This will require storage to meet the requirements when there is not enough solar generation available. It will be necessary to design the system around the winter months, as that is when the greatest storage is required. It will also be necessary to design around average usage pattern of a home, which means the bulk of the power consumption occurs during the evening and morning.
Using the typical residential usage and solar production curves in the graph below, battery storage will be needed for about 80% of the total daily usage. At 900 kilowatt-hours per month, that equates to 30 kilowatt-hours per day, which means the need to store 80%, or 24 kilowatt-hours. It will also require a system prepared for 3 days of cloudy weather, where the solar panels produce only about 20% of the total, therefore, add another 38 kilowatt-hours for a total of 62 kilowatts of storage. Today's prices for residential storage run about $800 per kilowatt, so the total cost for storage will be about $50K.
A total system cost, storage and solar, to be about $100K. With the assumption that the system will last 20 years with an average usage of 900 kilowatt-hours per month, the actual cost of electricity would be 47 cents per kilowatt-hour. This number will be used as a base-line as part of the North American solution to climate change.
The good news is that there is an electric grid which can connect to more efficient areas of production, and there is wind and hydro power to create even greater efficiency. The electric grid interconnects all of North America. If we combine the potential for all of our renewable resources, including the incredible hydro capacity in Northern Canada, a carbon-free and low-cost electric solution to tackle the challenge of climate change exists.
The production and load challenge
The grid is controlled by 13 different Independent System Operators (ISO). The job of the ISO is to ensure there is always adequate generation for the load.

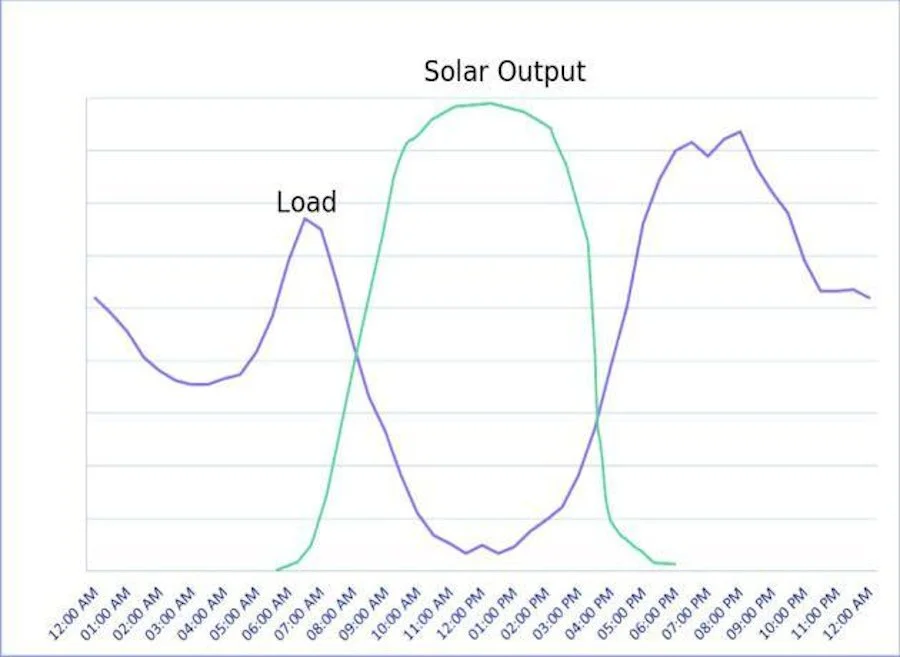
This chart shows us some interesting challenges. This graph shows the impact of solar generation in New England. Without solar, this graph would have shown a gradual increase in load from morning through evening. The graph shows the impact of solar as this is a very sunny day. While the solar has been very effective at reducing the overall load mid-day, the system still peaks in the evening. The problem for grid operators is that the system must be constructed to handle the peaks. If there was a way to extend the solar, the overall system investment costs can be reduced.
Here are the sources of generation on that same day:

This chart shows the challenge fof converting to 100% renewable energy supply 100% of the time. The positive impact that solar has made by reducing the natural gas generation required is evident. However, that natural gas generation fleet must be kept in place to be able to handle the peaks in the evening.
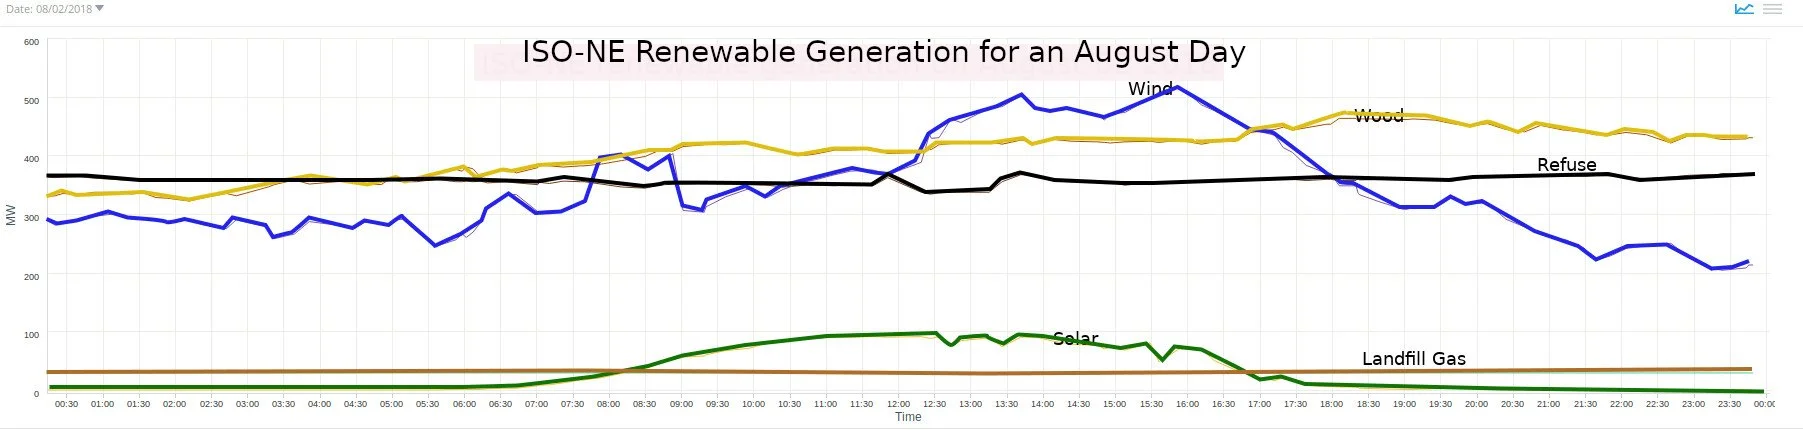
This was the renewable generation that was operating that day in this next graph:

This graph shows some interesting information. Note that the wind was very productive during the hours it was not needed. The wind blows when nature decides it is going to blow and it has little relationship to the demand requirements. It would be practical if the energy could be stored from the wind when it was blowing and released it during the daytime hours when it was needed. The solar production shows less than 100 Megawatts, yet in the first graph there must be a lot more solar production. The reason for this is that ISO-NE, which controls the grid, does not have visibility to net-metered solar, as well as any solar production facilities less than 5 Megawatts. ISO-NE considers this to be” dark generation”. This is solar because ISO-NE does have visibility to the other generation sources and none of the other sources were producing what was being consumed that day.
Here is the total system load for a day in April of the same year:
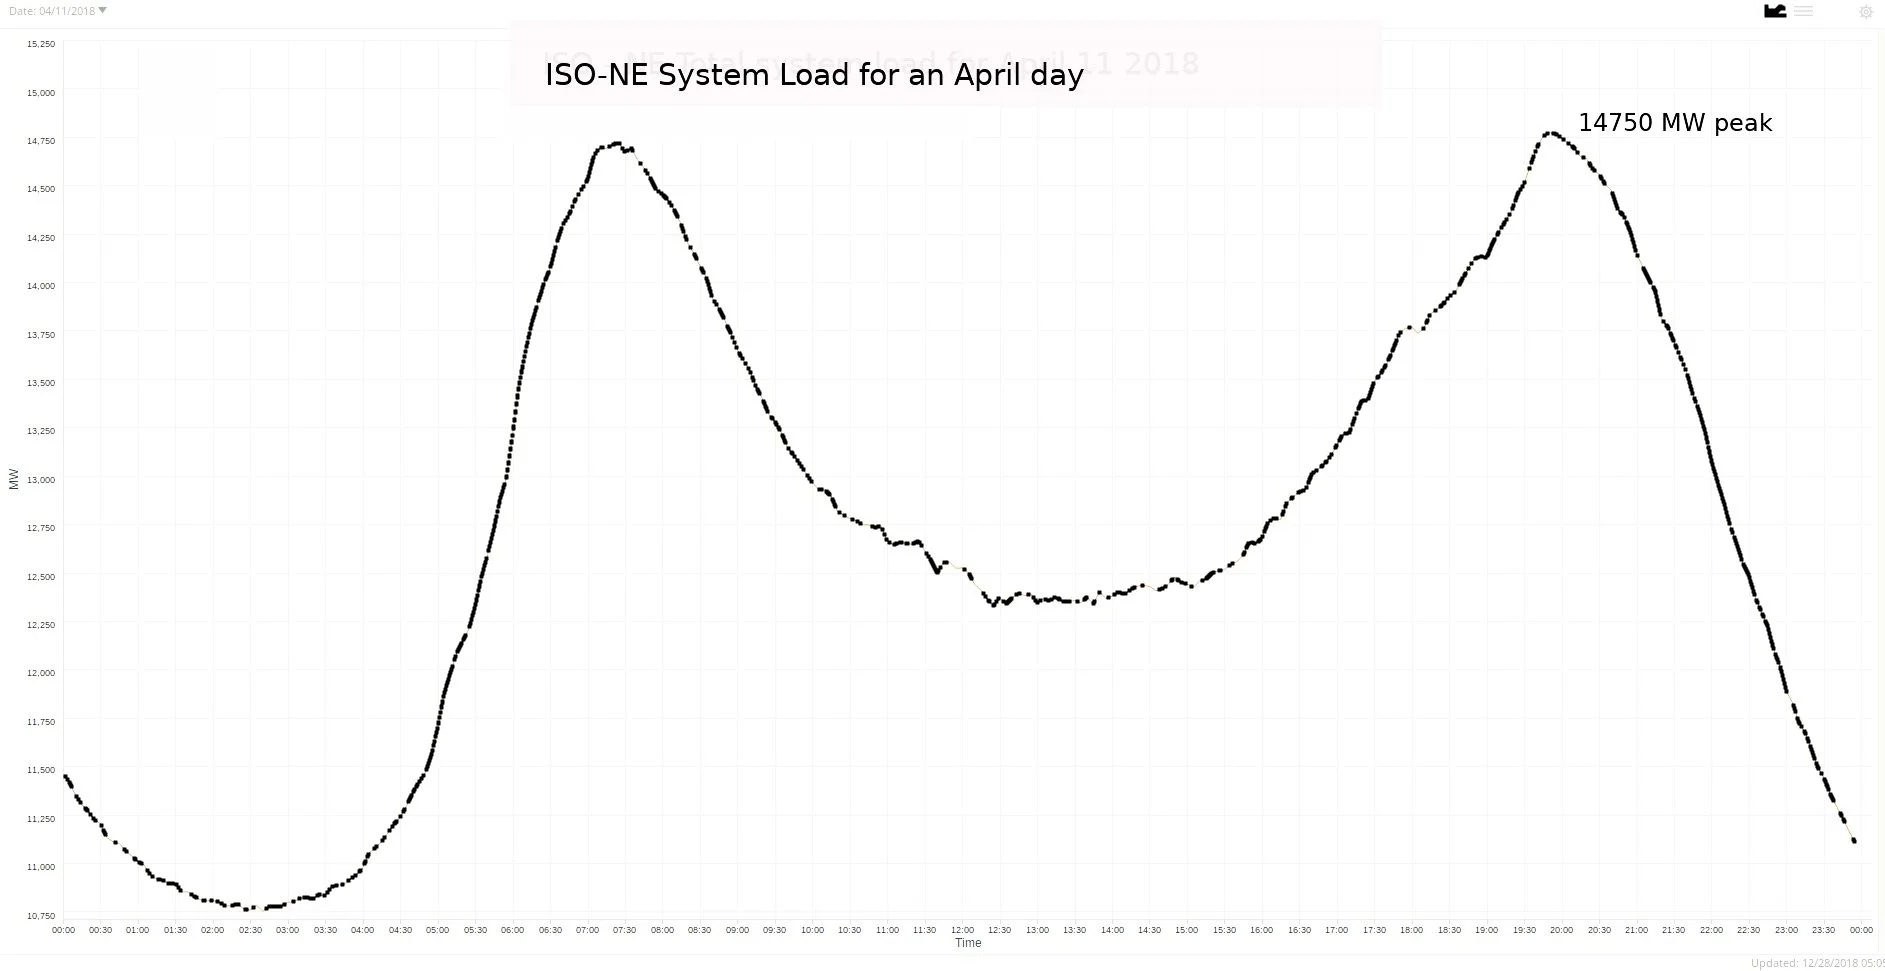
The drop in the load that is a result of the solar generation. The system peak load is in the evening when the sun goes down.
The total generation on that day:
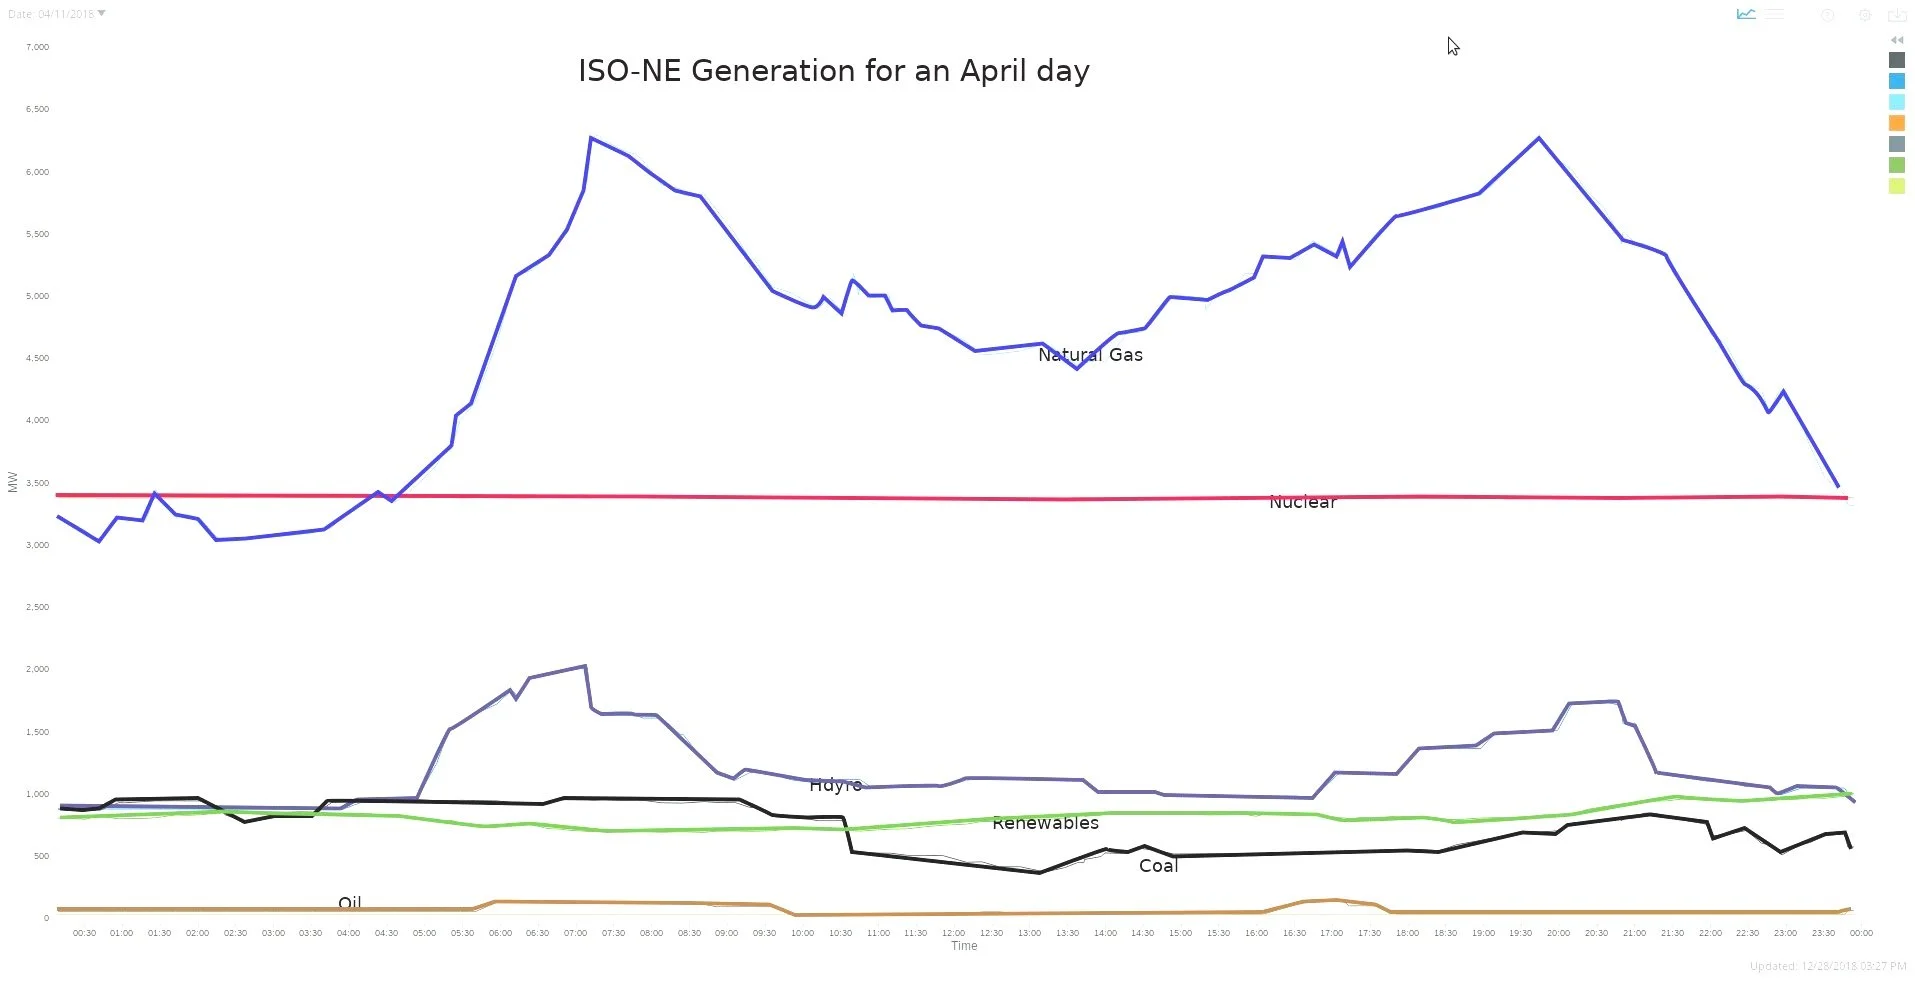
The drop in the use of natural gas while the solar production is in place is evident. Coal is being used that day for some of the generation. The coal generation is not displaced by the solar. Unfortunately, coal generators are harder to shut down (and fire up) than natural gas. It is important to recognize that coal generation emits 2-½ times the amount of locked carbon than that of natural gas. A kilowatt-hour of electricity produced by natural gas will emit 1 pound of carbon as opposed to 2.3 pounds emitted when producing with coal.
The renewable generation for that same day:
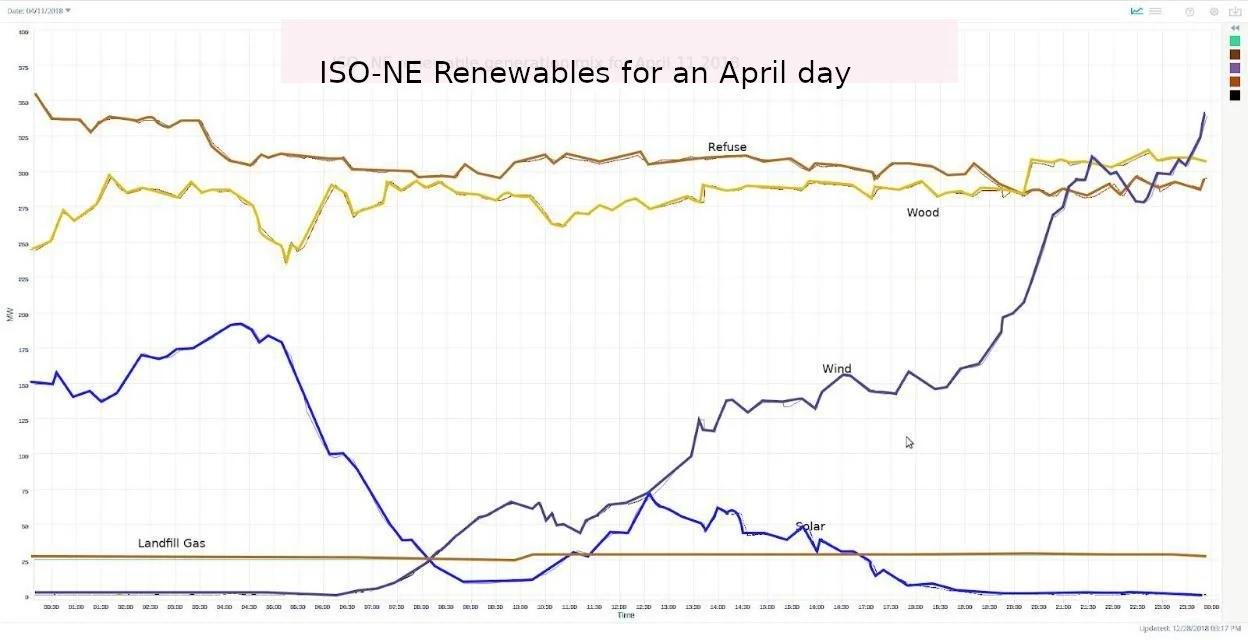
The wind starts to produce at the end of the day. Energy from burning municipal waste produces a significant amount of electricity in New England. This waste is then burned to create steam which is used to power a generator and create electricity. ISO-NE defines refuse as ”renewable” even though much of the energy from municipal waste comes from plastics.
A hot summer day in August. Here is the total system load chart:
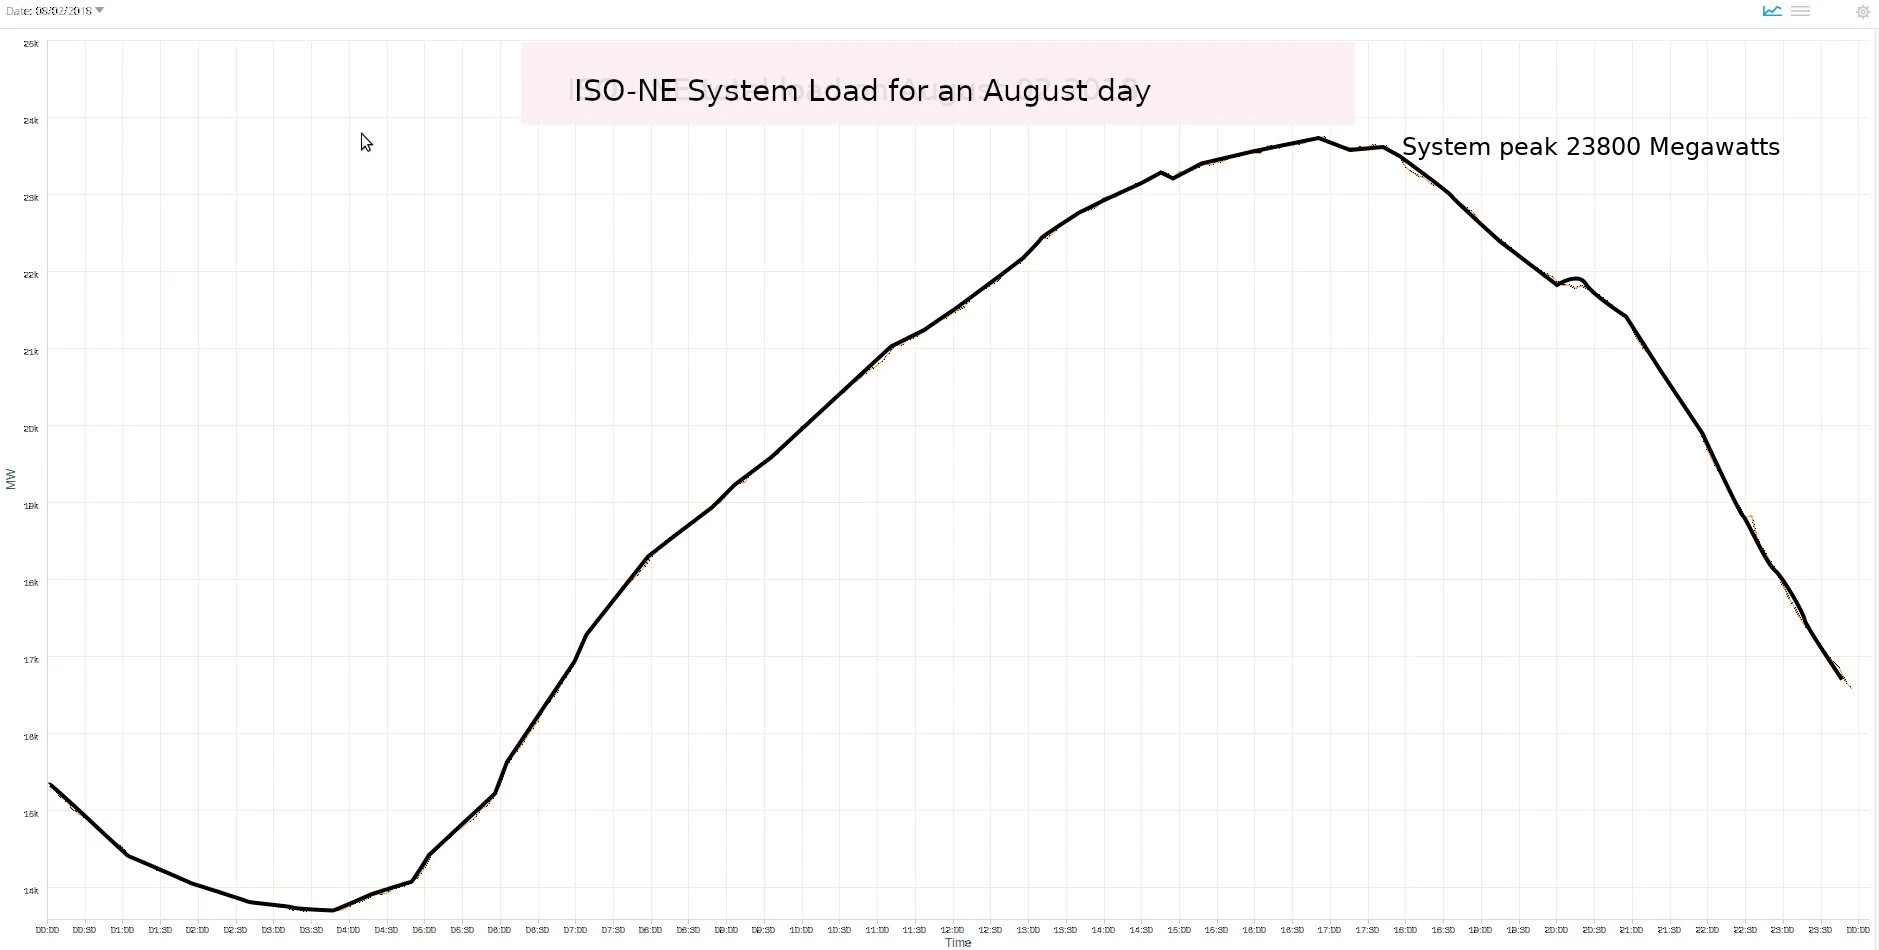
The total load was significantly more than in April (14750 megawatts). This is due to air conditioning load.
The generation sources (Note that the bulk of the generation is from natural gas):

Here is the renewable generation for that day:
The Solution
Canada is an important source of renewable energy with the United States being part of an interconnected North American grid – an important foundation of a renewable infrastructure . Canada is the second largest producer of hydro power, with China being the first. As neighbors, their hydro-power is much more valuable as a stored energy resource than for base-load power, which is how it is being used today. Canada presently has 75 Gigawatts of installed hydro, which compares to the 80 Gigawatts in the United States. The United States and Canada average close to 50% capacity factors for hydro power. Hydro power will be used there is not adequate wind and solar production. This also applies to hydro power in the United States. Hydro power is to be used as a “peaking” resource rather than a “baseload” resource.
The plan is to upgrade and interconnect the existing transmission system to form an international High Voltage Direct Current (HVDC) network to move power from coast to coast. This grid would include Canada. This would require a good-faith negotiation with adequate financial incentives for Canada to cooperate. The HVDC grid is used because it operates at such a high voltage that there is very little system loss (less than 2%) as a result. In the past, there were major concerns about security with such a network, as a hostile nation would be able to take out the entire grid by disabling this transmission component. Today, we have very fast switches that can isolate sections of the grid down to neighborhoods based on local conditions. With this distributed architecture, security is built into the grid at the local level, making it practically impossible to take down a grid. This must be a design requirement for all electric utilities moving forward. There will thousands of micro-grids into the international HVDC network.
The HVDC solution will have a significant reduction in the cost of renewable power to the residential user. If that solution just limited solar alone, as w with the first residential solar example, there are significant savings because solar power is able to be moved around the grid to where the need is. A HVDC grid will be able to move solar from the west coast, which will add 3 hours to daily solar production. By adding those three hours, the average daily production rises from 4.2 hours to 7.2 hours. This allows a reduction in the residential panel array example from 15 kilowatts to an 8.7 kilowatt-hour system. The cost is reduced from $47K to $27K. There will be a similar reduction battery storage requirements by at least this much because of the ability to import power from more sunny areas as well. This cuts the battery storage required in half. That brings the storage cost down from $50K to $25K. The total cost of the system is now $52K. At 900 kilowatt-hours per month, over a 20-year period, our residential electricity cost is now 24 cents per kilowatt-hour versus the 47 cents identified earlier.
Next step is to supplement the solar wit available wind. Wind production costs are about 5 cents per kilowatt-hour for Midwest and off-shore. Transmission costs are less than 2 cents. 3 cents are required for the distribution utility overhead costs. This now represents a landed residential cost e of 10 cents, to include the overhead needed to support the local distribution networks. This wind power will off-set ½ of the solar and storage needs. The solar and storage costs are cut in 1/2 and replaced with 10 cent power versus 24 cent power. The blended cost of residential power is now 17 cents per kilowatt-hour ( (10+24)/2) ).
Instead of using residential solar and storage, utility scale storage is used, which is ½ the cost. The solar and storage costs are reduced from $26k to $13K by using utility or grid-scale storage, The reason it is so much less expensive is the benefits of economies of scale. Rather than building a separate system for every home, the utility can build larger installations to serve communities. Significant reductions in construction, permitting and purchasing costs are a result. Our electricity cost is now at 11 cents per kilowatt hour versus the 17 cents described above.
There is much more to the solution to climate change than simply changing the supply of residential electricity. To eliminate carbon the entire transportation, industrial, and heating and cooling sectors over to electricity. This will require significant new construction of wind, solar, and storage resources. It will be important to look at the existing grid to optimize those resources. For example, locating a solar field in an existing location that has adequate grid resources will be significantly less expensive than a location that requires new construction of electrical infrastructure. Overall, there is a lot of capacity on the grid if care is taken about location selection. Several recent studies show that most of the grid can double the current electrical traffic without upgrades assuming considerations are placed on the location of the generation. That care can be further improved by utilizing a ”Smart Grid” which will be discussed later in this paper.
Optimization of hydro resources can be accomplished by using this power source when we there is not adequate wind and solar supply. A key part of this solution is looking at the efficiency of the entire system to ensure all possible waste has been eliminated in order to minimize the amount of electric resources needed. That said, simply electrifying transportation represents a significant improvement in efficiency. The efficiency of an electric motor is 95% compared to the efficiency of a gas motor at 25%. Another example of a dramatic improvement in efficiency is converting incandescent bulbs at 15 lumens per watt to L.E.D. bulbs at 100 lumens per watt.
As shown above, there is a long way to go in order that the current electric footprint is to be 100% renewable, 100% of the time. The solution is to start, state by state, by constructing as much wind and solar as possible, and developing interstate compacts to establish long-term power contracts that will enable construction of new facilities.
As the transportation, heating and cooling systems are converted to electricity, the design must not exacerbate current load patterns by simply allowing these units to charge and discharge randomly. As shown from the charts above, good system design will take advantage of the ability to shift those loads to when there are adequate supply resources. Load is needed when the wind is blowing and the sun is shining and when there is not enough load to consume all the generation.
The best way to encourage consumption when the generation is abundant and discourage consumption when resources are tight is through pricing. Today, electric utilities hedge the market for their consumers. The market price of power swings wildly. When there is excess generation during minimum load the price of power actually can go negative. Customers are paid to consume power! Conversely in many regions of the country, while the wholesale cost of electricity averages below 5 cents per kilowatt-hour, there are many times when the cost can go as high as $1 per kilowatt-hour when demand is high and generation is constrained.
The price of power on the wholesale market is directly related to supply and demand. If the demand is high when the supply is low, such as a very cold winter day in New England, prices skyrocket. Conversely, at night, when demand drops off, prices fall. Recently, we have seen prices very low during the day when the temperature is moderate and the sun is shining. This is the new pricing trend that is a result of the increasing renewable generation available to the grid.
The technology exists today to send these prices directly to the electric vehicles, heating and cooling systems, and appliances. Providing the opportunity for the end consumer to be able to take advantage of the market pricing will give the consumer more control over the electricity prices, provide tremendous opportunity for savings, and most importantly, will encourage load when there are excess supplies of renewable generation. Providing the opportunity to give the consumer more control over their energy use is the way to make this transition work
Optimizing the pricing for the consumer can all be done automatically through a simple user interface. These technologies are available off-the-shelf today. Using an electric vehicle as an example, the consumer does not care what time of night the vehicle batteries are charged. A consumer can simply give the instruction to make sure the car is adequately charged when they leave in the morning. Through the interface to the grid, the car will charge when prices are lowest.
There are products today that actually utilize hot water heaters as loads for excess renewable generation. These devices communicate with the grid and tell the water heater to heat up when there is excess generation available. These products also ensure that the consumer has hot water when they need it.
This communication is very important in facilitating greater penetration of renewable generation on the grid. Today there are examples, such as in Northern Vermont, where renewable generation has to be shut down due to the fact that there is not enough load on the system. When the wind is blowing and the sun is shining, Northern Vermont has 350 Megawatts of generation on an electric grid that is only capable of moving 250 Megawatts. Increasing the capacity of the grid is expensive. A much less expensive alternative would be to have the ability to add load through interactive grid communication with appliances. As the entire energy system is electrified, including transportation, heating and cooling, these communication technologies will be key to success.
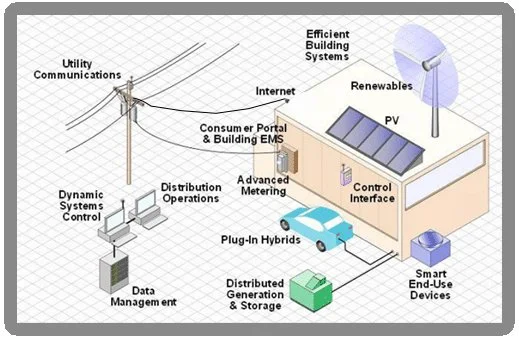
The foundation for the conversion of the entire energy system to 100% renewable power 100% of the time is the Smart Grid. This grid will have a continuous conversation between the appliances, the grid, and the generation sources to ensure optimization of resources in real time. Every device will be tied into the grid. To ensure maximum security, the grid will use a single-purpose utility network to push signals and requests out to the end appliances. Then, the internet will be used for return signaling and confirmation. This will ensure maximum levels of security and that hackers will not be able to access the network.
Another key component of moving to 100% renewable energy 100% of the time is strategic investment and strategic grid location of batteries. Overall, battery storage is the holy grail for extensive deployment of renewables. At a minimum, batteries provide the necessary correction for the choppiness of wind and solar as described above.
The deployment of batteries has already begun. Several utilities have started to incentive storage systems in residential homes as, not only can these systems provide storage to help the grid, they also can provide high quality power, which help appliances last longer, and back-up for those homes during power outages.
However, the best return for investment in storage comes from coupling the storage with renewable generation. Battery storage reduces or eliminates the need for costly grid upgrades.
Again using solar in the northeast as an example. The capacity factor of solar in the northeast is 17.5%. Deploying solar on a single power line that is capable of a 5-Megawatt solar field without storage, there will be a total of 7,665 Megawatt hours of production on an annual basis (5 Megawatts X 8,760 hours/year X .175). However, optimizing that power line with storage, results in much as 43,800-Megawatt hours annually from that same power line. That same power line can support a 28.5-Megawatt solar field and store the energy while it produces more than the feeder, and release it to always keep within the confines of the feeder. Add a smart grid to the feeder to turn on loads during peak production will result in even more renewable generation on that same feeder.
Utility scale battery storage prices are coming down rapidly. As of this writing, the Capital Cost of storage less than $300 per kilowatt-hour. At $300 capital cost, renewable energy will be very competitive with fossil fuels assuming that the grid is optimized based on the principles laid out in this document. The idea that it costs money to solve climate change is simply a myth. It makes sense to be planning our transition away from fossil fuels immediately. Even the climate change skeptics should be persuaded by the cost argument.
North American Solution – Action Steps
Come to agreements with states to sign on to the North American Solution to Climate Change.
Establish commissions to oversee the roll-out at the international and regional level. These commissions will provide methodologies, as well as technical and educational support.
Utilize and expand the existing networks to provide education and advocacy.
Recruit volunteers to consult and provide communications.
Utilize social media platforms to hold regularly scheduled town halls to coordinate, and communicate.
Encourage towns, cities and communities across America and Canada to pass climate change resolutions.
Develop a detailed timeline and key performance measures.
Develop the plan and route for the HVDC network utilizing existing corridors.
Pass legislation in supportive states, communities and provinces.
Support the states, communities, and provinces with planning methodologies and education.
Introduce legislation at the federal level to require Corporate Average Fuel Economy standards (CAFE) that will transition our transportation fleet to all-electric over a ten-year period.
Introduce legislation at the federal level for the heating and cooling sector to achieve Coefficient of Performance (COP) standards of 3.0 or greater over a ten-year period.
Work with the distribution utilities and consumers to provide education and support.
Start negotiations with transmission operators, ISO’s, and states to plan and construct the HVDC network.
Require the electric utilities to construct the required networks.
Permit the HVDC grid.
Construct the HVDC grid